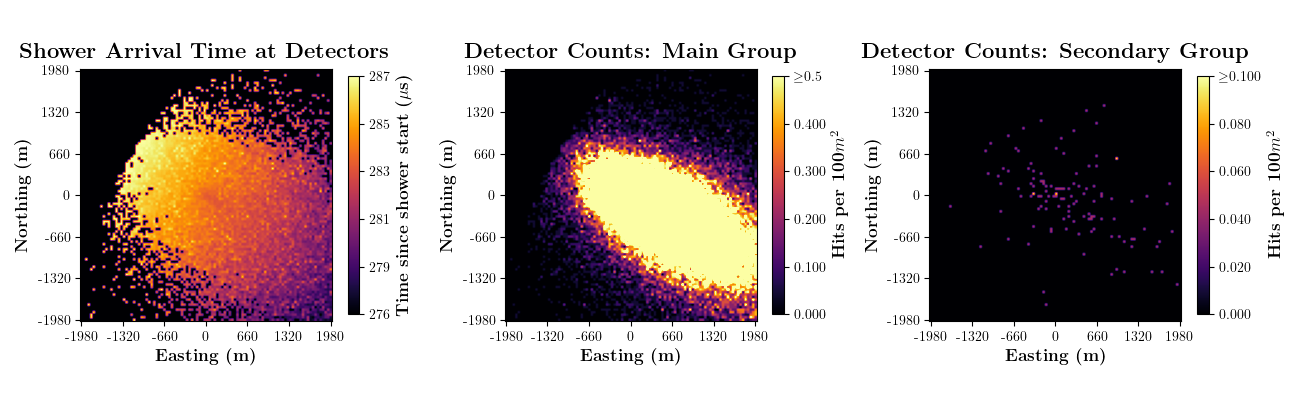
Figure S1: Example features collected for a single gamma-ray event. For each detector (represented by the pixels in each figure), we plot three measurements of the induced atmospheric shower. Left: Average arrival time of secondary shower particles. Center: Number of detections of “main” shower particles (photons, electrons, and positrons). Right: Number of detections of “secondary” shower particles (muons, all other possible shower particles).
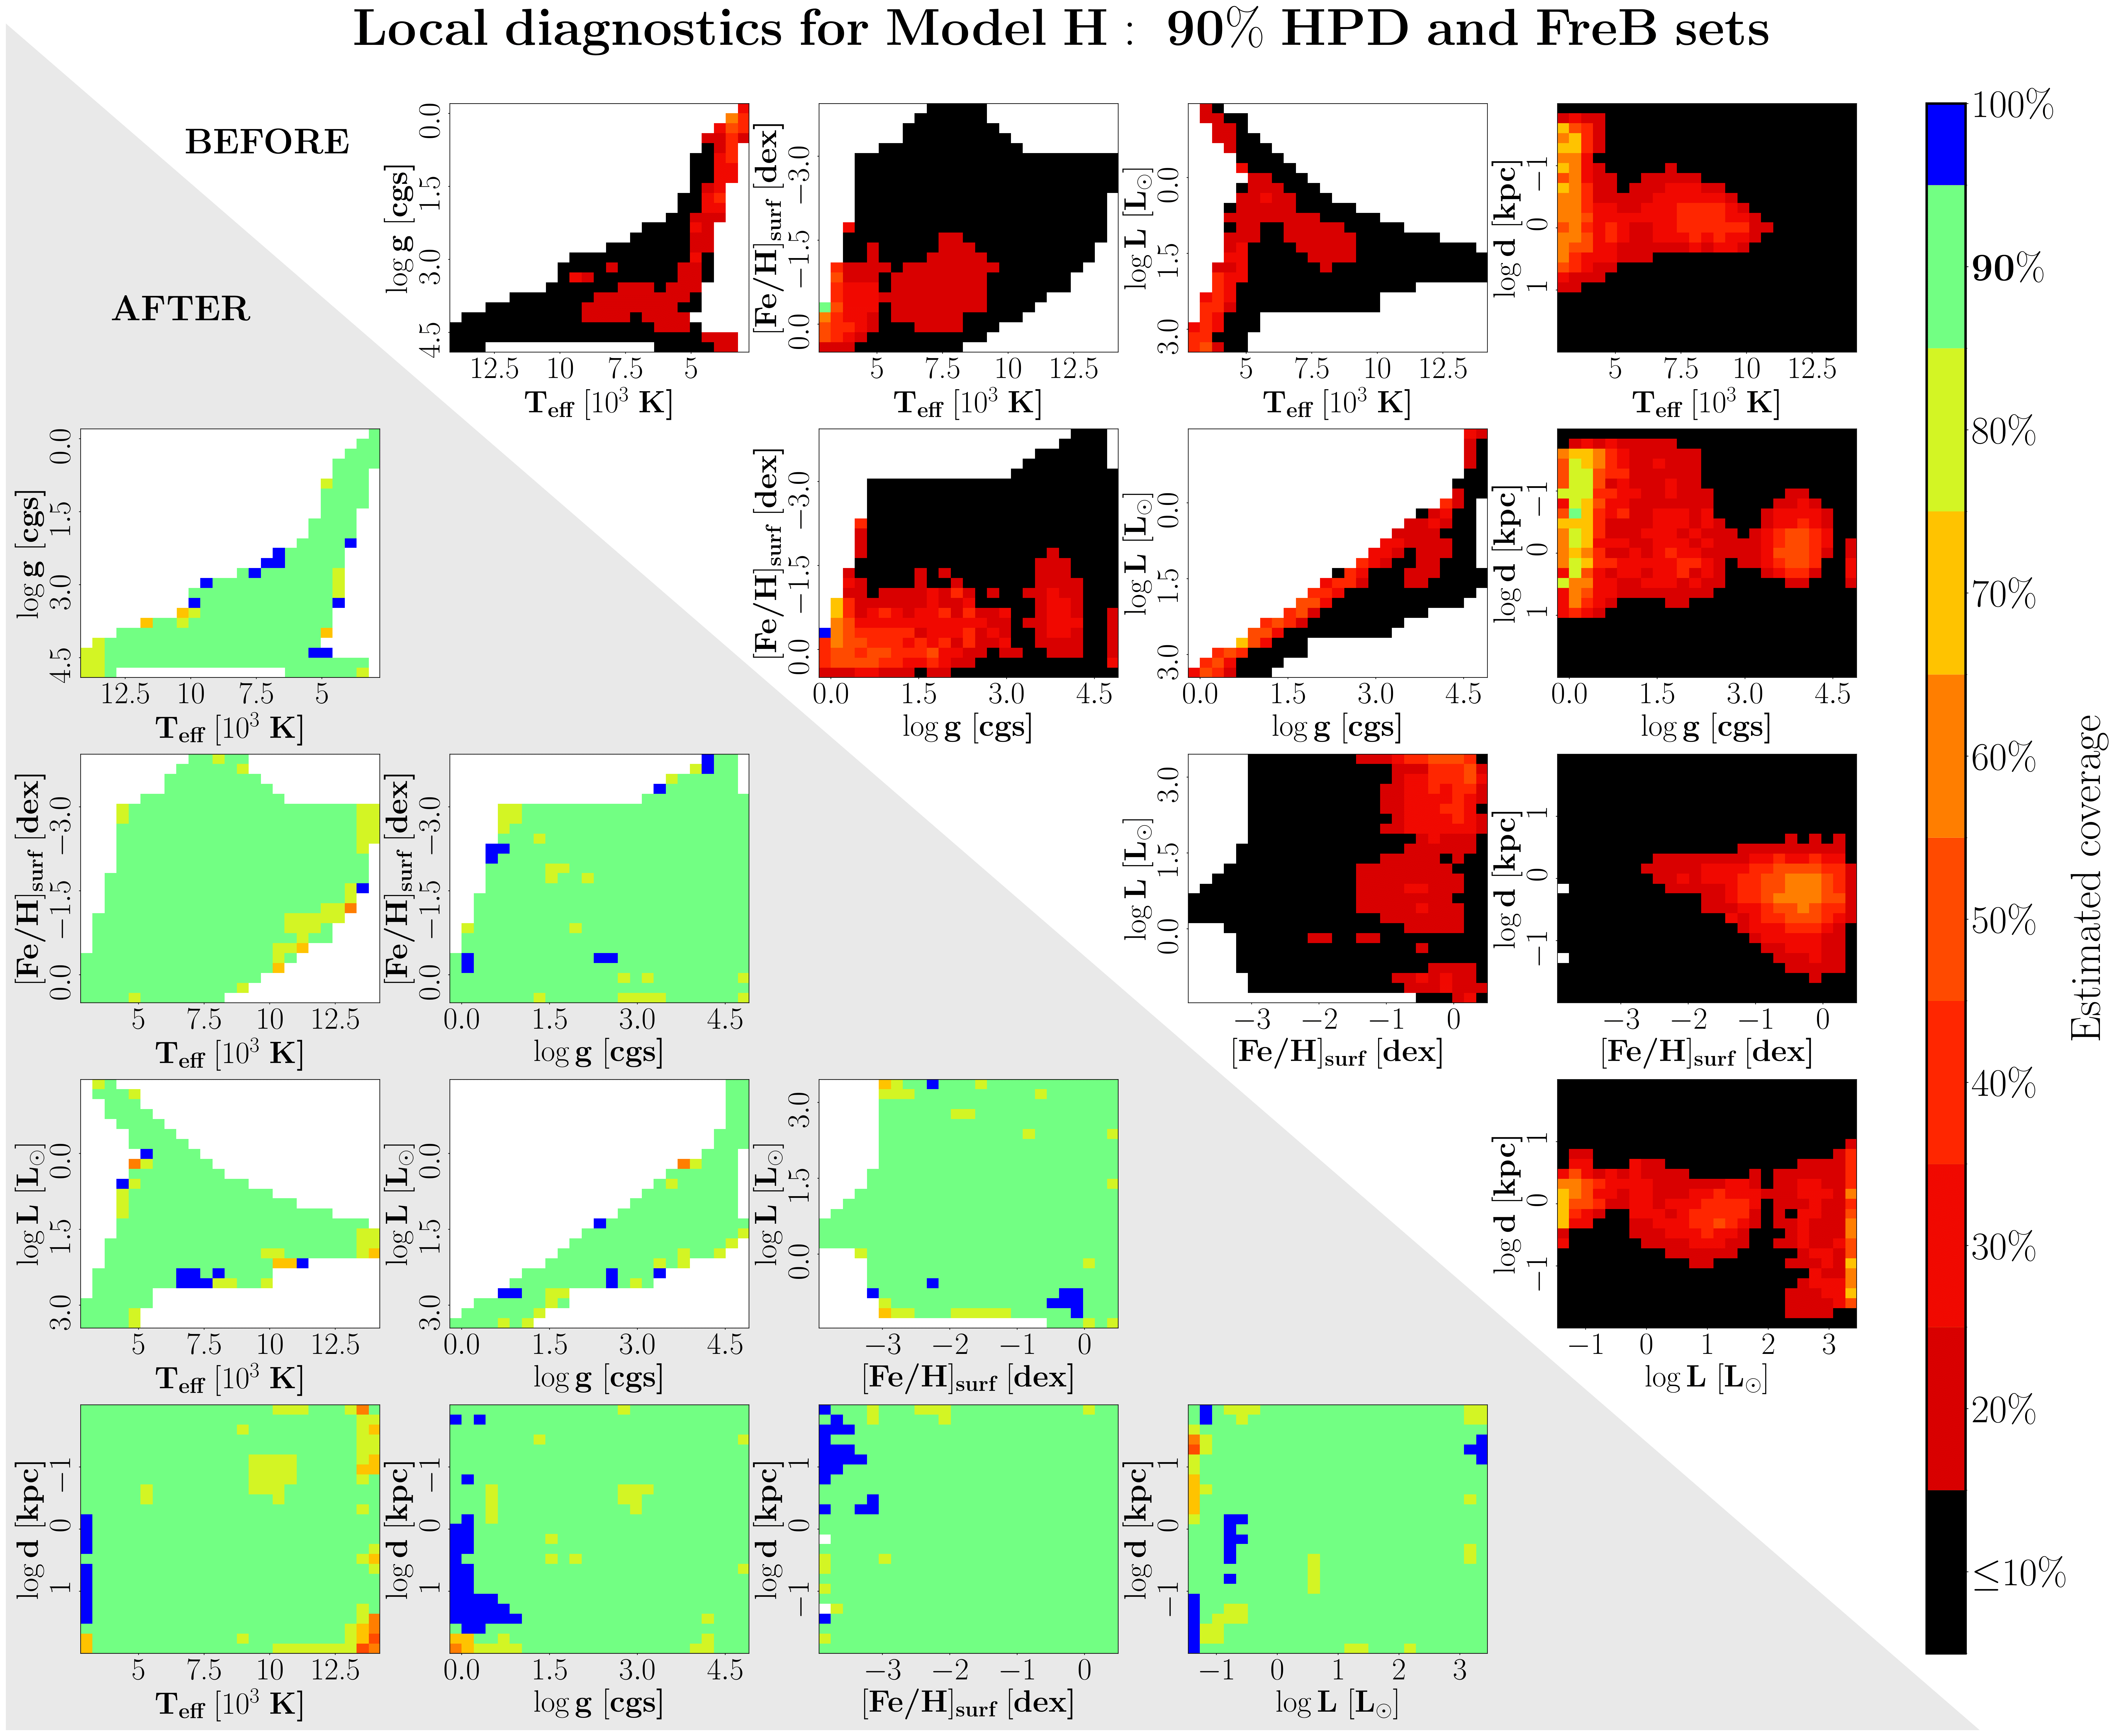
Figure S2: Local diagnostics for Model H. Upper right triangle: the average coverage probability of a 90% HPD credible set is often found to severely undercover. Lower left triangle: After reshaping the posterior, the coverage probability of a 90% FreB confidence set is in general closer to the nominal value.
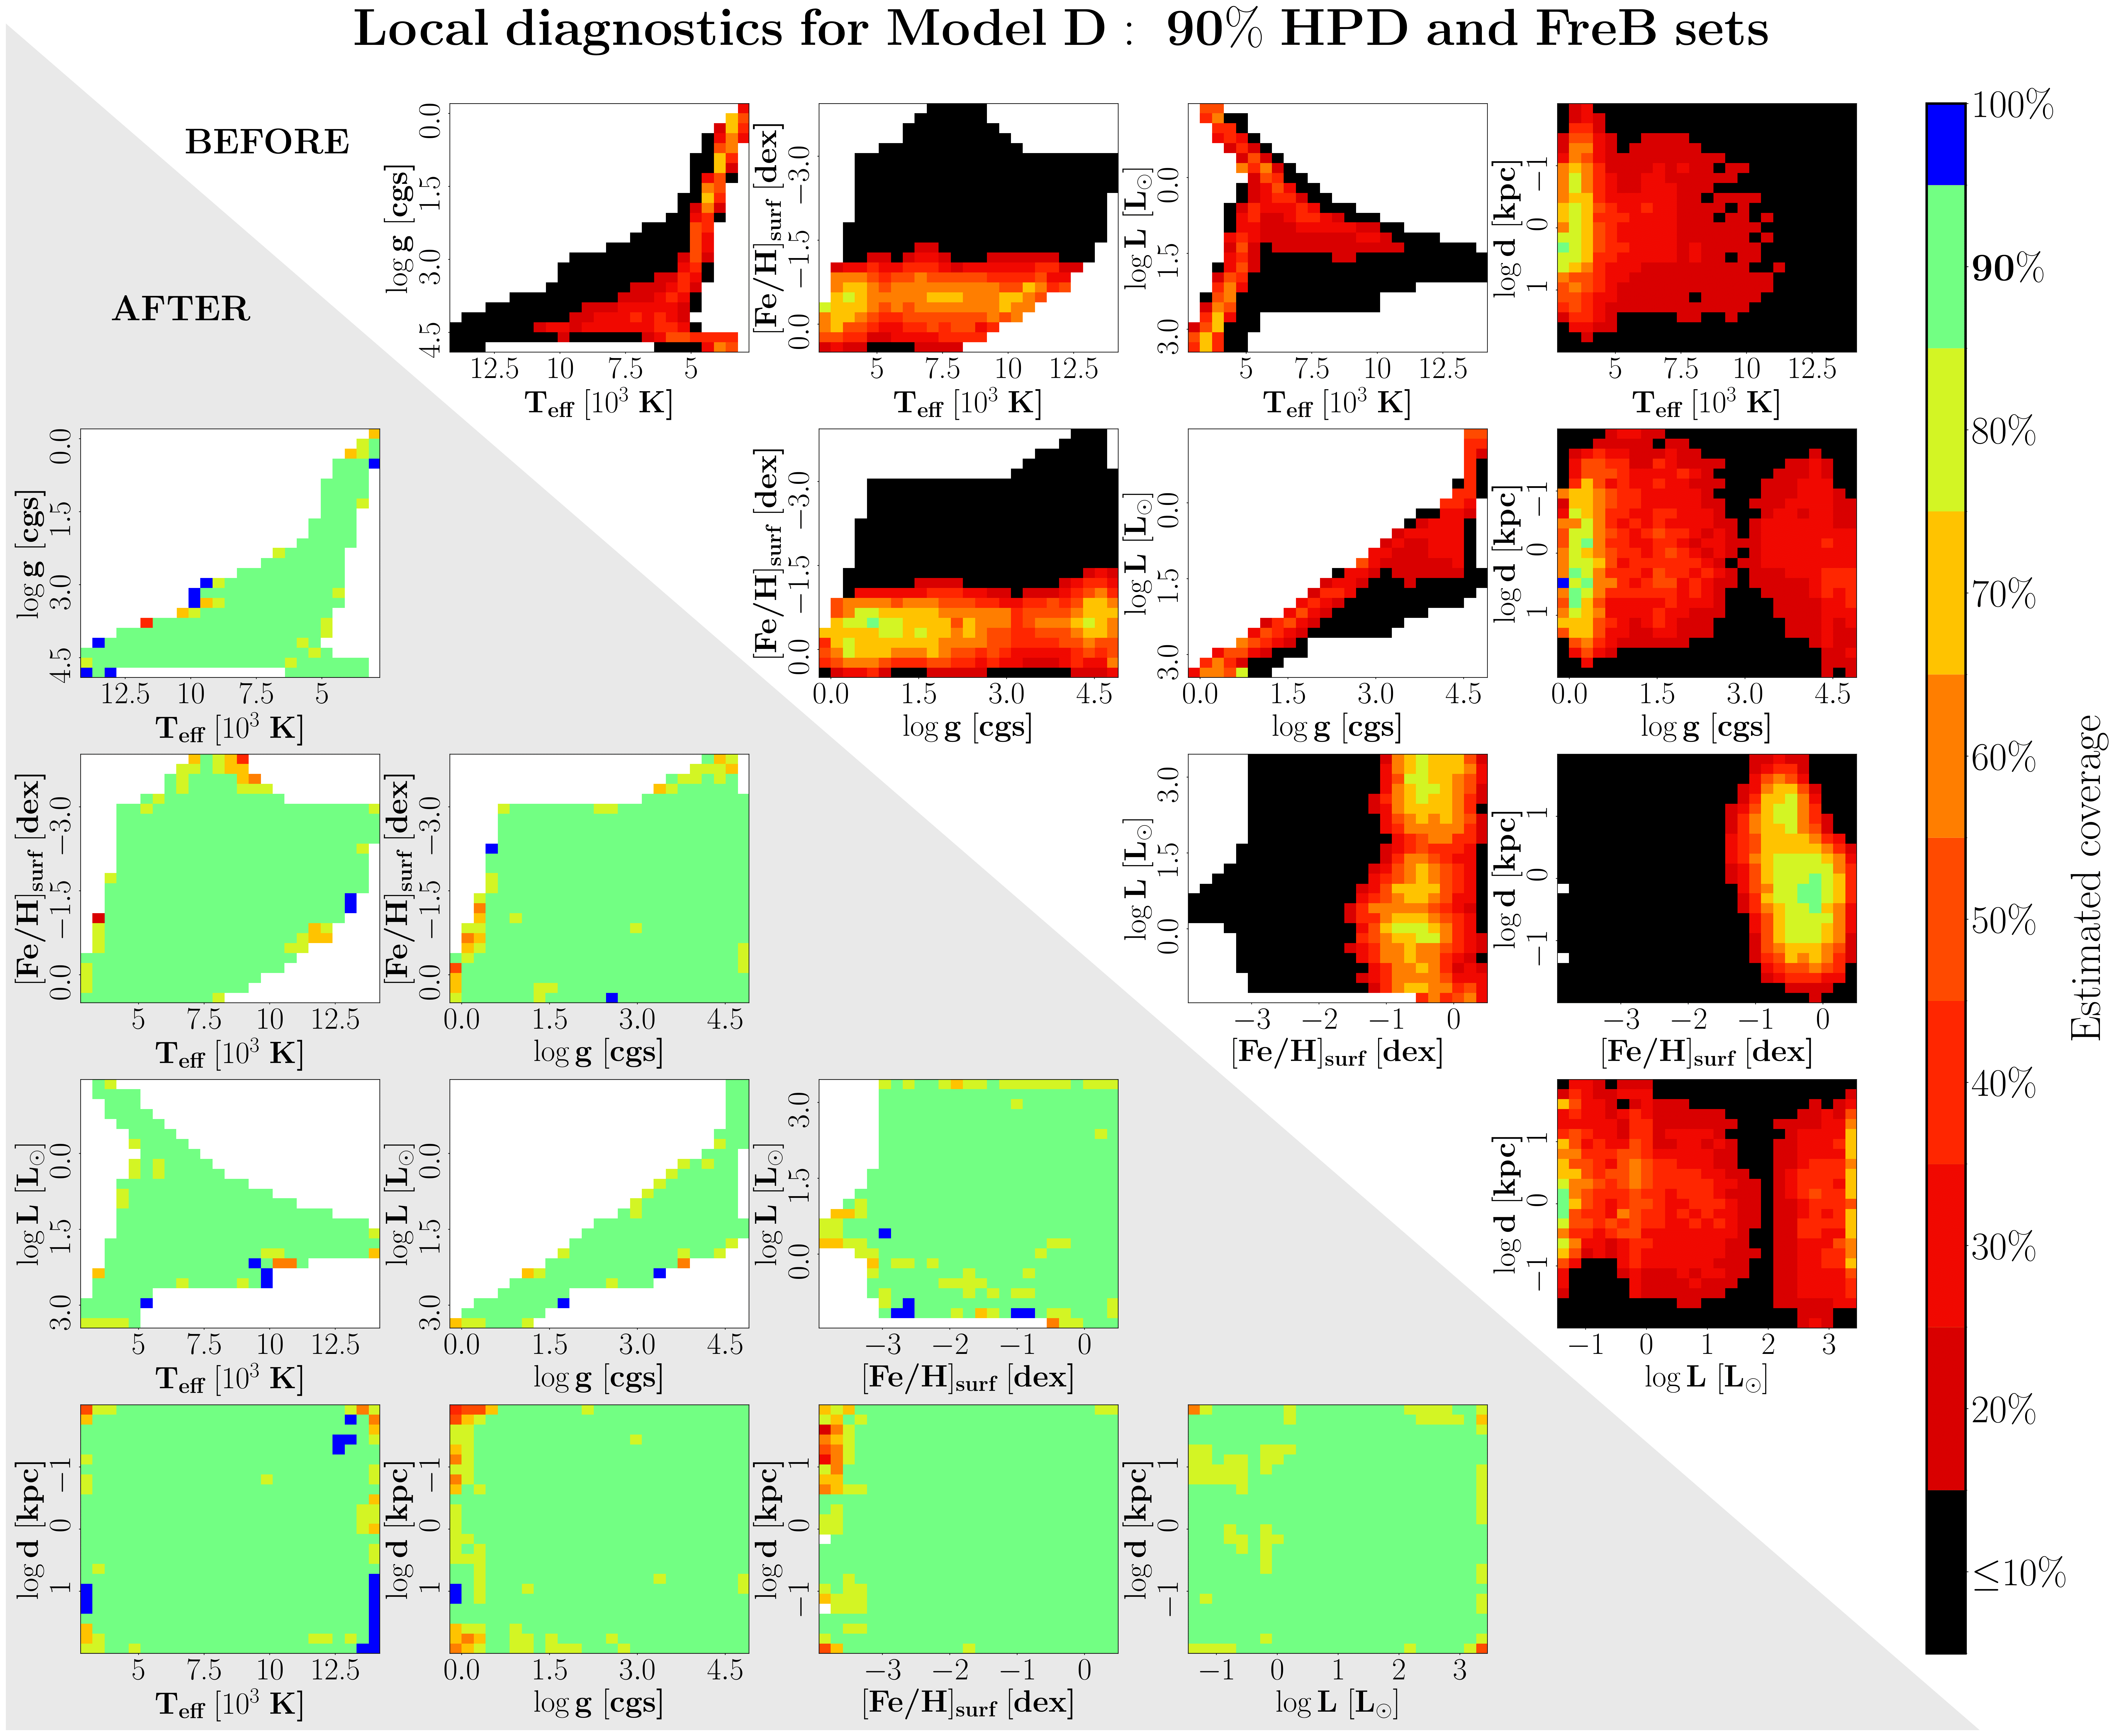
Figure S3: Local diagnostics for Model D. Upper right triangle: As with Figure S2, the average coverage probability of a 90% HPD credible set is still far below 90%. Lower left triangle: The coverage probability of a 90% FreB confidence set is close to the nominal value.
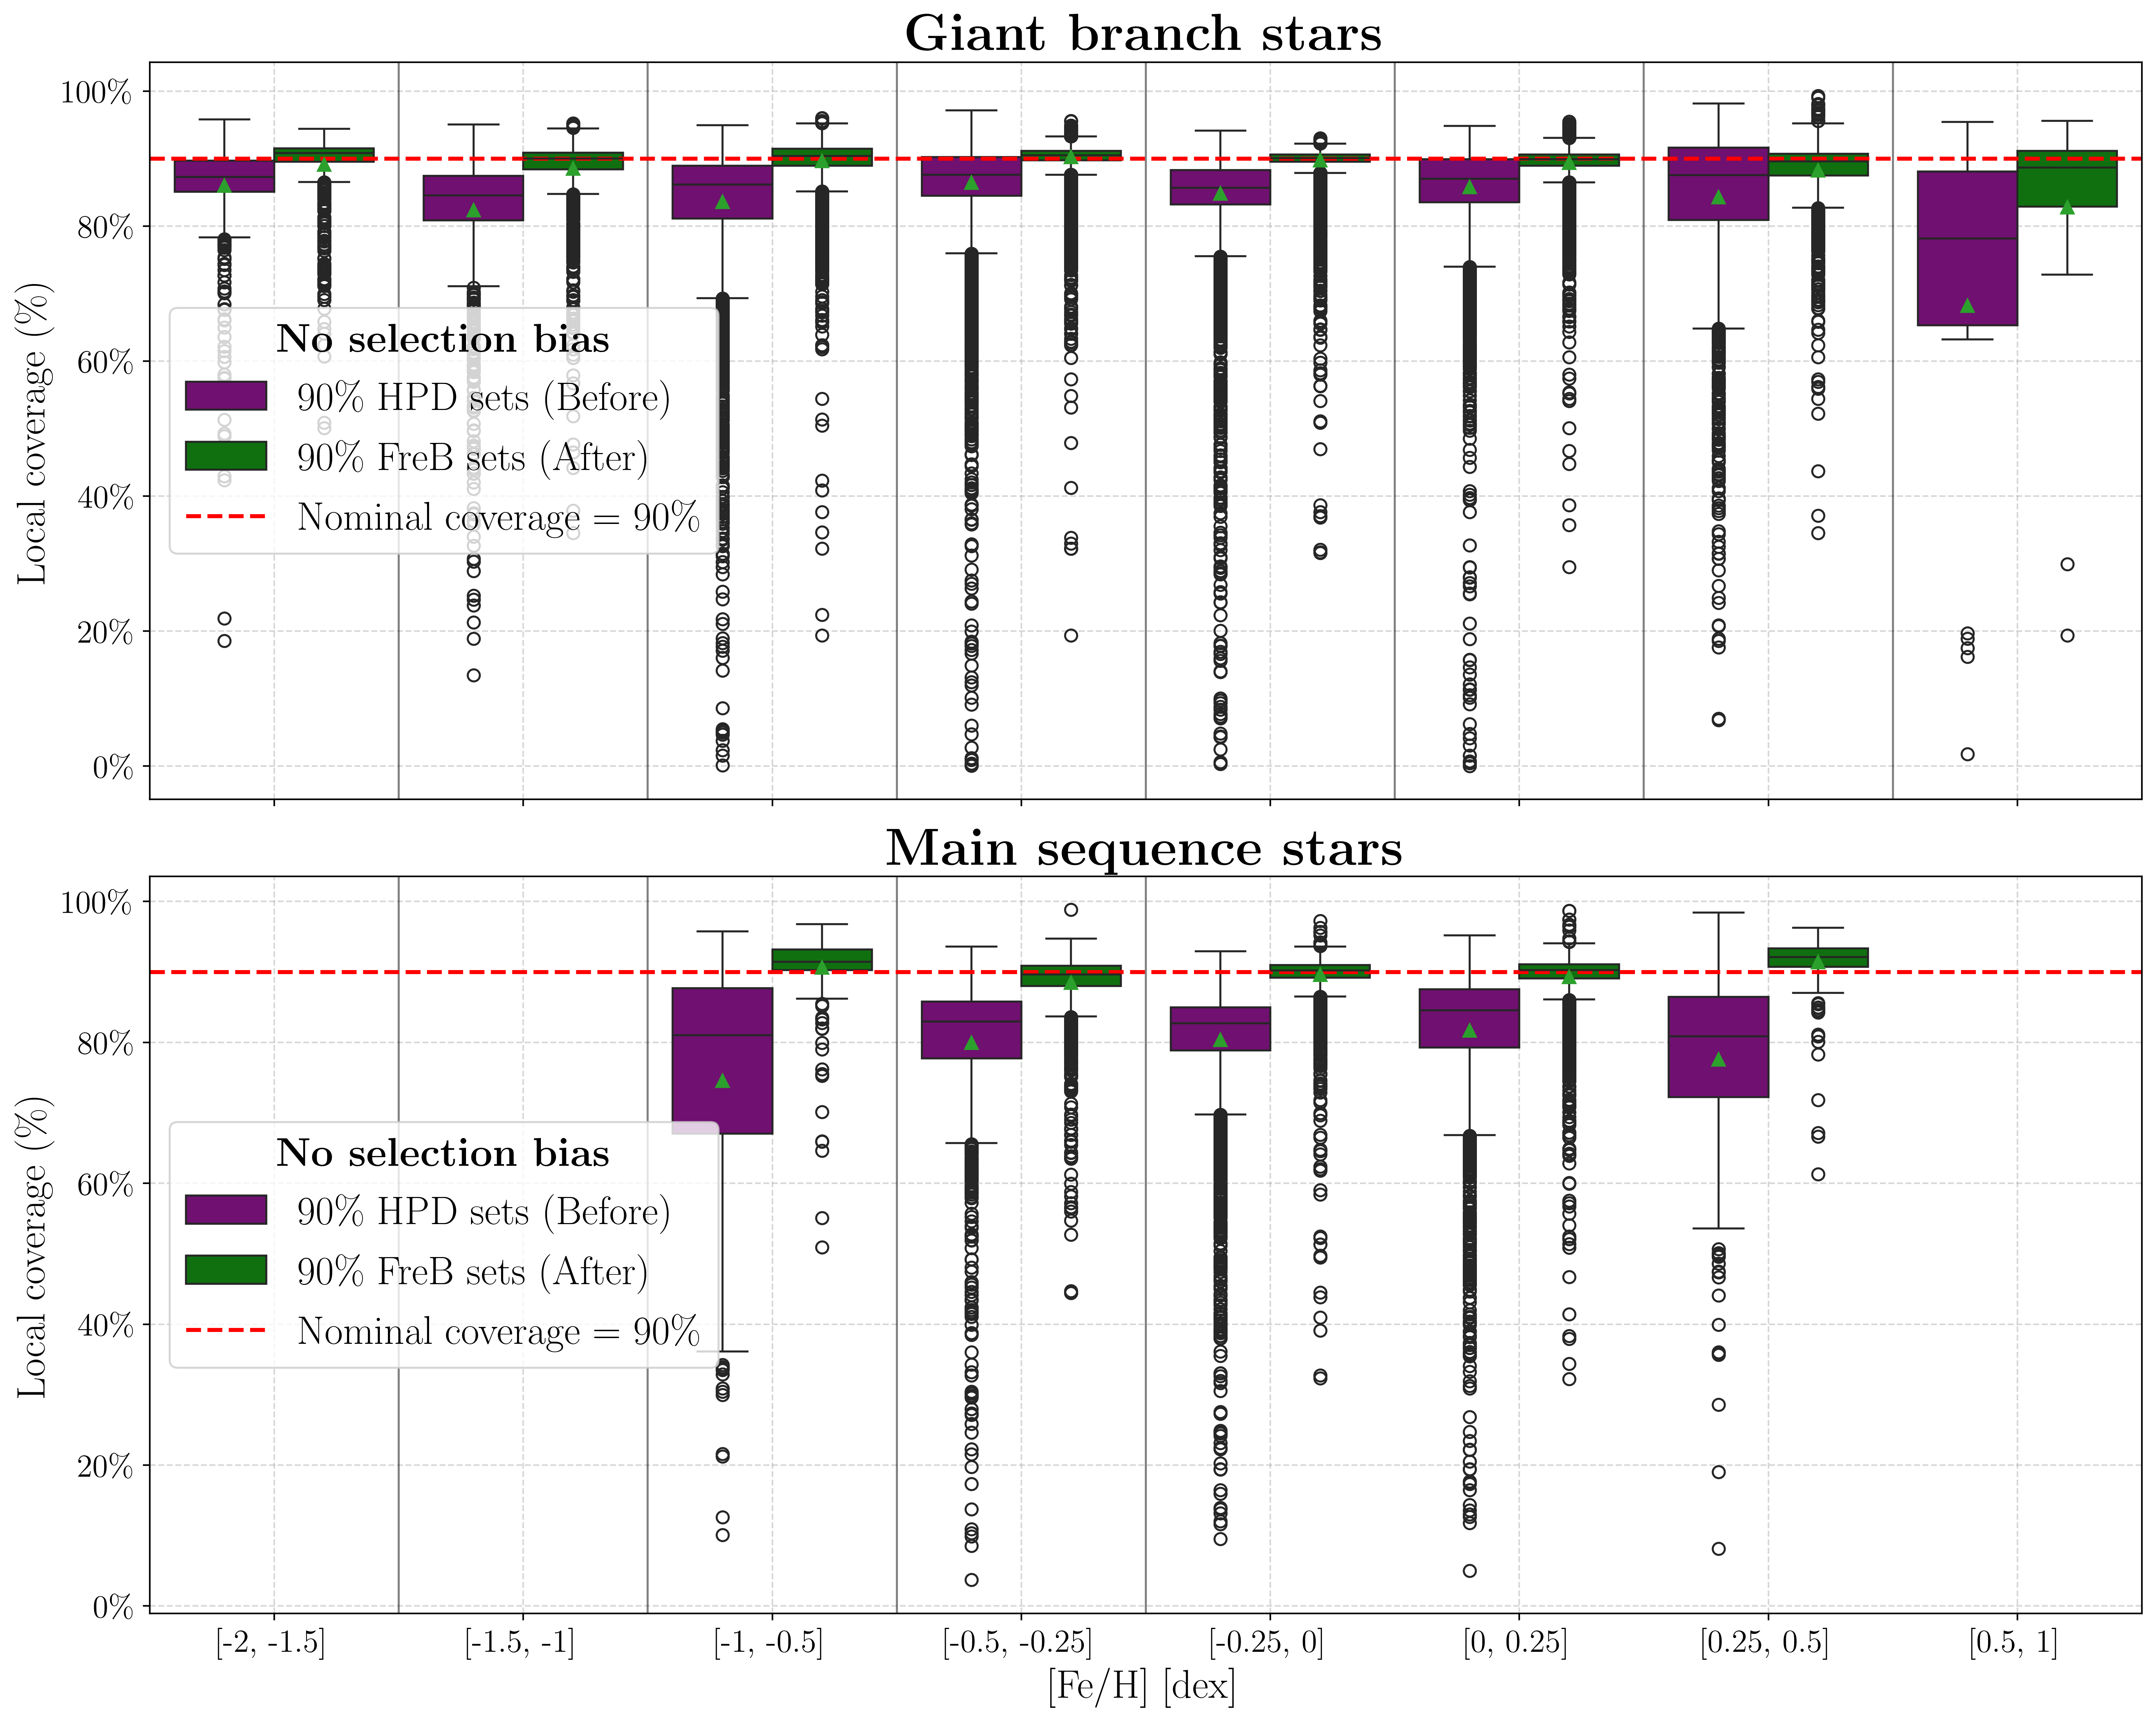
Figure S4: Local diagnostics by metallicity in the no selection bias setting. Boxplots of the estimated coverage of target data (see main text Figure 3b). HPD sets undercover for, for example, metal-poor GB stars (top panel) with metallicity around \([Fe/H]=-1.0\) dex as well as for MS stars (bottom panel), with the actual chance of including the true parameter values often being closer to 80%. After adjusting the posteriors, the coverage probability of FreB sets is close to the nominal 90% value for all stars.
Figure S5: Local diagnostics by metallicity in the selection bias setting. Boxplots of the estimated coverage of target data (see main text Figure 3c). HPD sets severely undercover for, for example, metal-poor GB stars (top panel) as well as for MS stars (bottom panel), with the chance of including the true parameter values sometimes being close to 0%. After adjusting the posteriors, the coverage probability of FreB sets is close to the nominal 90% value for all stars.